Ficheiro:Atmospheric Transmission.svg

Os contidos da páxina non están dispoñibles noutras linguas.
Na Galipedia, a Wikipedia en galego.

Ficheiro orixinal(ficheiro SVG; resolución de 741 × 724 píxeles; tamaño do ficheiro: 321 kB)

Renderizar esta imaxe en .

Resumo

Descrición
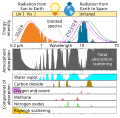
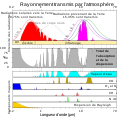
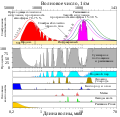
English: This figure shows the absorption bands in the Earth's atmosphere (middle panel) and the effect that this has on both solar radiation and upgoing thermal radiation (top panel). Individual absorption spectrum for major greenhouse gases plus Rayleigh scattering are shown in the lower panel.
Data
Orixe This figure was prepared by Robert A. Rohde for the Global Warming Art project.
Autoría Д.Ильин: vectorization (File:Atmospheric Transmission-ru.svg); Cepheiden translation back to english
Outras versións

[editar]


.svg:

.png:

 
Esta imaxe vectorial foi creada co Inkscape .
Translate this file

Este ficheiro SVG emprega texto encapsulado que pode ser traducido doadamente a calquera lingua usando un editor SVG como Inkscape ou Adobe Illustrator. Vexa máis información. Tamén pode descargalo e traducilo manualmente empregando un editor de texto.


This figure shows the absorption bands in the Earth's atmosphere (middle panel) and the effect that this has on both solar radiation and upgoing thermal radiation (top panel). Individual absorption spectrum for major greenhouse gases plus Rayleigh scattering are shown in the lower panel.

Both the Earth and the Sun emit electromagnetic radiation (e.g. light) that closely follows a blackbody spectrum, and which can be predicted based solely on their respective temperatures. For the Sun, these emissions peak in the visible region and correspond to a temperature of ~5500 K. Emissions from the Earth vary following variations in temperature across different locations and altitudes, but always peak in the infrared.

The position and number of absorption bands are determined by the chemical properties of the gases present. In the present atmosphere, water vapor is the most significant of these greenhouse gases, followed by carbon dioxide and various other minor greenhouse gases. In addition, Rayleigh scattering, the physical process that makes the sky blue, also disperses some incoming sunlight. Collectively these processes capture and redistribute 25-30% of the energy in direct sunlight passing through the atmosphere. By contrast, the greenhouse gases capture 70-85% of the energy in upgoing thermal radiation emitted from the Earth surface.

Data sources and notes

The data used for these figures is based primarily on Spectral Calculator of GATS, Inc. archive copy at the Wayback Machine which implements the LINEPAK system of calculating absorption spectra (Gordley et al. 1994) from the HITRAN2004 (Rothman et al. 2004) spectroscopic database. To aid presentation, the absorption spectra were smoothed. Features with a bandwidth narrower than 0.5% of their wavelength may be obscured.

Calculations were done on the assumption of direct vertical transmission through an atmosphere with gas concentrations representative of modern day averages. In particular, absorption would be greater for radiation traveling obliquely through the atmosphere as it would encounter more gas.

The total scattering and absorption curve includes only the components indicated in the lower panel. These represent the vast majority of absorption contributing to the greenhouse effect and follow the treatment of Peixoto and Oort (1992), but other minor species such as carbon monoxide, nitric oxide and chloroflourocarbons (CFCs) have been omitted. Also omitted was scattering due to aerosols and other sources besides Rayleigh scattering.

The peaks in the blackbody spectra were adjusted to have the same height for ease in presentation.

Licenza

Eu, como posuidor dos dereitos de autor desta obra, pola presente publícoa baixo a seguinte licenza:
Creative Commons CC-Zero Este ficheiro está dispoñible baixo a licenza Creative Commons de renuncia universal ao dominio público 1.0.
A persoa que asociou unha obra con este documento, deu a obra ao dominio público renunciando a todos os seus dereitos sobre ela en todo o mundo baixo as leis de dereitos de autor e relacionadas ou dereitos legais derivados que tiña sobre a obra, na medida permitida pola lei. Pode copiar, modificar, distribuír e empregar esta obra, mesmo para fins comerciais, sen necesidade dun permiso por parte do autor.

References

  • Gordley, Larry L., Benjamin T. Marshall, Allen D. Chu (1994). "LINEPAK: Algorithms for modeling spectral transmittance and radiance". Journal of Quantitative Spectroscopy & Radiative Transfer 52 (5): 563-580.
  • L.S. Rothman, D. Jacquemart, A. Barbe, D. Chris Benner, M. Birk, L.R. Brown, M.R. Carleer, C. Chackerian Jr., K. Chance, L.H. Coudert, V. Dana, V.M. Devi, J.-M. Flaud, R.R. Gamache, A. Goldman, J.-M. Hartmann, K.W. Jucks, A.G. Maki, J.-Y. Mandin, S.T. Massie, J. Orphal, A. Perrin, C.P. Rinsland, M.A.H. Smith, J. Tennyson, R.N. Tolchenov, R.A. Toth, J. Vander Auwera, P. Varanasi, G. Wagner (2004). "The HITRAN 2004 molecular spectroscopic database". Journal of Quantitative Spectroscopy & Radiative Transfer 96: 139-204.
  • Peixoto, Jose P. and Abraham H. Oort (1992) Physics of Climate, Springer ISBN: 0883187124.

Other versions

[editar]


.svg:

.png:

Pés de foto

Engada unha explicación dunha liña do representa este ficheiro

Elementos retratados neste ficheiro

representa a

130a81475d186ffb00ef185c7f981dd1fab93805

tamanho dos dados portugués

328.865 Byte

724 píxel

741 píxel

Historial do ficheiro

Prema nunha data/hora para ver o ficheiro tal e como estaba nese momento.

Data/HoraMiniaturaDimensiónsUsuarioComentario
actual18 de abril de 2023 ás 16:19Miniatura da versión ás 16:19 do 18 de abril de 2023741 × 724 (321 kB)EfbrazilAdding white background color so renders correctly on smartphone
7 de agosto de 2022 ás 20:29Miniatura da versión ás 20:29 do 7 de agosto de 2022741 × 724 (321 kB)Efbrazilcolor bug fix
7 de agosto de 2022 ás 20:00Miniatura da versión ás 20:00 do 7 de agosto de 2022741 × 724 (321 kB)EfbrazilFixed translations as best as possible using text editor for new layout
7 de agosto de 2022 ás 19:34Miniatura da versión ás 19:34 do 7 de agosto de 2022741 × 724 (320 kB)EfbrazilFixing text alignment
7 de agosto de 2022 ás 19:26Miniatura da versión ás 19:26 do 7 de agosto de 2022741 × 724 (320 kB)EfbrazilGraphical improvements as per discussion page
17 de febreiro de 2022 ás 17:59Miniatura da versión ás 17:59 do 17 de febreiro de 2022741 × 724 (208 kB)Pierre cbFile uploaded using svgtranslate tool (https://svgtranslate.toolforge.org/). Added translation for fr.
18 de marzo de 2021 ás 22:10Miniatura da versión ás 22:10 do 18 de marzo de 2021741 × 724 (180 kB)Cepheidengerman labels adjusted
18 de marzo de 2021 ás 22:09Miniatura da versión ás 22:09 do 18 de marzo de 2021741 × 724 (180 kB)Cepheidencorrection of labels
18 de marzo de 2021 ás 22:06Miniatura da versión ás 22:06 do 18 de marzo de 2021741 × 724 (180 kB)CepheidenFile uploaded using svgtranslate tool (https://svgtranslate.toolforge.org/). Added translation for de.
18 de marzo de 2021 ás 21:52Miniatura da versión ás 21:52 do 18 de marzo de 2021741 × 724 (154 kB)Cepheiden=={{int:filedesc}}== {{Information |description= {{en|1=This figure shows the absorption bands in the Earth's atmosphere (middle panel) and the effect that this has on both solar radiation and upgoing thermal radiation (top panel). Individual absorption spectrum for major greenhouse gases plus Rayleigh scattering are shown in the lower panel.}} |date=2021-03-18 |source=This figure was prepared by Robert A. Rohde for the Global Warming Art project. |author=[[User:Д.Ил...

A seguinte páxina usa este ficheiro:

Uso global do ficheiro

Os seguintes wikis empregan esta imaxe:

Metadatos