
Ficheiro:Asinobstfeldrogoff.png

Ficheiro orixinal (818 × 714 píxeles; tamaño do ficheiro: 28 kB; tipo MIME: image/png)
| Este ficheiro procede de Wikimedia Commons. A continuación móstrase a información da súa páxina de descrición. Commons é un repositorio libre de ficheiros multimedia. Pode contribuír alí cargando as súas imaxes. |
Resumo
| Descrición |
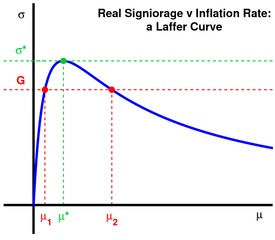
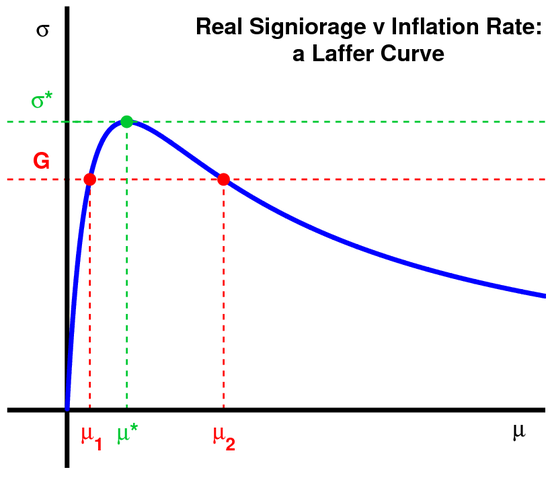
English: Real Signiorage vs. Inflation Rate (Laffer Curve) |
| Data | 9 de xullo de 2010 (data do carregamento) |
| Orixe | Obra propia |
| Autoría | Picodoro |
The curve is as in Maurice Obstfeld, Kenneth S. Rogoff, Foundations of International Macroeconomics, Massachusetts Institute of Technology, 1996, ISBN 0262150476 (chapter 8, Money and Exchange Rates under Flexible Prices, section 2, The Cagan Model of Money and Prices, paragraph 6, Seigniorage, pp. 523-525). The matlab code to generate the image is as follows (although I made some minor manual adjustments):
gm = [0:0.001:8];
eta = 1;
S = gm .* ((1 + gm) .^ (-eta - 1));
gm_star = 1 / eta;
S_star = gm_star * ((1 + gm_star) ^ (-eta - 1));
G = 0.2;
syms x real;
gm_G = eval(solve(x * ((1 + x) ^ (-eta - 1)) - G, 'x'));
figure1 = figure('Position', [393 18 782 686], 'PaperPosition',[0.1322 5.764 20.67 18.14], 'PaperSize',[20.98 29.68], 'PaperType','a4letter');
set(gcf, 'Color', 'none');
plot([-2, 8], [S_star, S_star], '--', 'Color', [0, 200, 50] / 255, 'LineWidth', 2)
hold on
plot([gm_star, gm_star], [0, S_star], '--', 'Color', [0, 200, 50] / 255, 'LineWidth', 2)
plot([gm_G(1), gm_G(1)], [0, G], '--r', 'LineWidth', 2)
plot([gm_G(2), gm_G(2)], [0, G], '--r', 'LineWidth', 2)
plot([-2, 10], [G, G], '--r', 'LineWidth', 2)
plot([-2, 8], [0, 0], '-k', 'LineWidth', 5)
plot([0, 0], [-0.1, 0.4], '-k', 'LineWidth', 5)
plot(gm, S, '-', 'LineWidth', 5)
plot(gm_G(1), G, '.r', 'MarkerSize', 40)
plot(gm_G(2), G, '.r', 'MarkerSize', 40)
plot(gm_star, S_star, '.', 'Color', [0, 200, 50] / 255, 'MarkerSize', 40)
set(gca, 'XLim', [-1, 8]);
set(gca, 'YLim', [-.05, .35]);
set(gca, 'Color', 'none', 'LineWidth', 2, 'FontSize', 16, 'FontWeight', 'bold', 'Box', 'off', 'Position', [0.0179028 0.0335277 0.971867 0.950437], ...
- 'OuterPosition', [-0.14512 -0.0947522 1.25402 1.16618])
- 'OuterPosition', [-0.14512 -0.0947522 1.25402 1.16618])
set(gca, 'Visible', 'off')
annotation1 = annotation(...
- figure1, 'textbox', ...
- 'BackgroundColor', 'none', ...
- 'FitHeightToText', 'off', ...
- 'FontSize', 24, ...
- 'FontWeight', 'bold', ...
- 'HorizontalAlignment', 'center', ...
- 'LineStyle', 'none', ...
- 'Position', [0.8963 0.0609 0.0875 0.1143],...
- 'String',{'\mu'});
- figure1, 'textbox', ...
annotation2 = annotation(...
- figure1, 'textbox', ...
- 'BackgroundColor', 'none', ...
- 'FitHeightToText', 'off', ...
- 'Color', 'r', ...
- 'FontSize', 24, ...
- 'FontWeight', 'bold', ...
- 'HorizontalAlignment', 'center', ...
- 'LineStyle', 'none', ...
- 'Position', [0.2480 0.0624 0.0875 0.1143],...
- 'String',{'\mu_1'});
- figure1, 'textbox', ...
annotation3 = annotation(...
- figure1, 'textbox', ...
- 'BackgroundColor', 'none', ...
- 'FitHeightToText', 'off', ...
- 'Color', 'r', ...
- 'FontSize', 24, ...
- 'FontWeight', 'bold', ...
- 'HorizontalAlignment', 'center', ...
- 'LineStyle', 'none', ...
- 'Position', [0.5805 0.0609 0.0875 0.1143],...
- 'String',{'\mu_2'});
- figure1, 'textbox', ...
annotation4 = annotation(...
- figure1, 'textbox', ...
- 'BackgroundColor', 'none', ...
- 'FitHeightToText', 'off', ...
- 'Color', [0, 200, 50] / 255, ...
- 'FontSize', 24, ...
- 'FontWeight', 'bold', ...
- 'HorizontalAlignment', 'center', ...
- 'LineStyle', 'none', ...
- 'Position', [0.3656 0.0610 0.0875 0.1143],...
- 'String',{'\mu*'});
- figure1, 'textbox', ...
annotation5 = annotation(...
- figure1, 'textbox', ...
- 'BackgroundColor', 'none', ...
- 'FitHeightToText', 'off', ...
- 'Color', [0, 200, 50] / 255, ...
- 'FontSize', 24, ...
- 'FontWeight', 'bold', ...
- 'HorizontalAlignment', 'center', ...
- 'LineStyle', 'none', ...
- 'Position', [0.1239 0.7184 0.0875 0.1143],...
- 'String',{'\sigma*'});
- figure1, 'textbox', ...
annotation6 = annotation(...
- figure1, 'textbox', ...
- 'BackgroundColor', 'none', ...
- 'FitHeightToText', 'off', ...
- 'FontSize', 24, ...
- 'FontWeight', 'bold', ...
- 'HorizontalAlignment', 'center', ...
- 'LineStyle', 'none', ...
- 'Position', [0.1162 0.8641 0.0875 0.1143],...
- 'String',{'\sigma'});
- figure1, 'textbox', ...
annotation7 = annotation(...
- figure1, 'textbox', ...
- 'BackgroundColor', 'none', ...
- 'FitHeightToText', 'off', ...
- 'Color', 'r', ...
- 'FontSize', 24, ...
- 'FontWeight', 'bold', ...
- 'HorizontalAlignment', 'center', ...
- 'LineStyle', 'none', ...
- 'Position', [0.1253 0.5449 0.0875 0.1143],...
- 'String',{'G'});
- figure1, 'textbox', ...
annotation6 = annotation(...
- figure1, 'textbox', ...
- 'BackgroundColor', 'none', ...
- 'FitHeightToText', 'off', ...
- 'FontSize', 24, ...
- 'FontWeight', 'bold', ...
- 'HorizontalAlignment', 'center', ...
- 'LineStyle', 'none', ...
- 'Position', [0.1162 0.8641 0.0875 0.1143],...
- 'String',{['Real Signiorage v Inflation Rate:'; ' a Laffer Curve ']});
- figure1, 'textbox', ...
Licenza
- Vostede é libre de:
- compartir – copiar, distribuír e difundir a obra
- facer obras derivadas – adaptar a obra
- Baixo as seguintes condicións:
- recoñecemento – Debe indicar a debida atribución de autoría, fornecer unha ligazón á licenza e indicar se se realizaron cambios. Pode facer isto de calquera forma razoable, mais non nunha forma que indique que quen posúe a licenza apoia ou subscribe o seu uso da obra.
- compartir igual – Se altera, transforma ou amplía este contido, debe publicar as súas contribucións baixo a mesma licenza ou outra compatible á orixinal.

|
Autorízase a copia, distribución e/ou modificación deste documento baixo os termos da licenza de documentación libre GNU, versión 1.2 ou calquera outra que posteriormente publique a Free Software Foundation; sen seccións invariables, textos de portada, nin textos de contraportada. Inclúese unha copia da devandita licenza na sección titulada GNU Free Documentation License. |
Historial do ficheiro
Prema nunha data/hora para ver o ficheiro tal e como estaba nese momento.
| Data/Hora | Miniatura | Dimensións | Usuario | Comentario | |
|---|---|---|---|---|---|
| actual | 9 de xullo de 2010 ás 10:17 | | 818 × 714 (28 kB) | Picodoro | {{Information |Description={{en|1=Real Signiorage vs. Inflation Rate (Laffer Curve)}} |Source={{own}} |Author=Picodoro |Date=9/07/2010 |Permission= |other_versions= }} The curve is as in Maurice Obstfeld, Kenneth S. Rogoff, ''Foundations |
Uso do ficheiro
A seguinte páxina usa este ficheiro:
Uso global do ficheiro
Os seguintes wikis empregan esta imaxe:
- Uso en it.wikiversity.org